Being well-known for fast delivery and customer service, huge selection of product is a missing piece that Tiki has been working on in the past few years. We opened Marketplace to have more sellers and hence more selection. Our Retail business — where Tiki purchases and manages our own inventory — is also growing rapidly, with that comes an interesting challenge: how much inventory should we purchase at any point in time ? And how much out of that should we put in each of our warehouses ? Also, how to do all that guesswork for millions of products ?
Having too little inventory will lead to out-of-stock, where customers can see the listed product but can’t purchase. Having too many of them will solve that but lead to wasted cash. Having the right amount of inventory at the “wrong” warehouse (too far from customers) is not ideal either as it will increase the time it takes for us to deliver.
So, having the “optimal” inventory (the right quantity at the right warehouse) for our millions of product — which we called “inventory replenishment” process — is the key to satisfy customers and still having a sustainable business model. We aim to achieve that with our Demand forecast platform.
Problem statement
Inventory replenishment has always been a crucial process of every trading business. At TIKI, this used to be handled manually by merchandising team based on their experiences (read: gut-feeling) with their products and market trend. It works for the early days where we have not so many products/warehouses and cost optimization is not a big concern. However, when our trading business starts growing with emphasis on both customer satisfaction and sustainability, each merchandiser then needs to handle larger categories with huge number of products and strict margin/inventory level target. With all those constraints, the manual approach doesn’t work well anymore and that’s where software solution adds value.
Our Demand forecast platform aims to combine Machine Learning with classical time series forecasting methods to analyze and learn patterns in historical data and try to predict demand in the future.
With a strong engineering foundation in both data processing and machine learning, the forecast can be applied for as much as millions of products with many different signals (historical demand, upcoming promotions, page-view etc). We want to build a platform so flexible that our data scientist can easily add new signals, run experiment againts our vast data warehouse, find out which signals work best and integrate it into our forecast model to continuously improve its accuracy.
Our approach
Forecasting methods
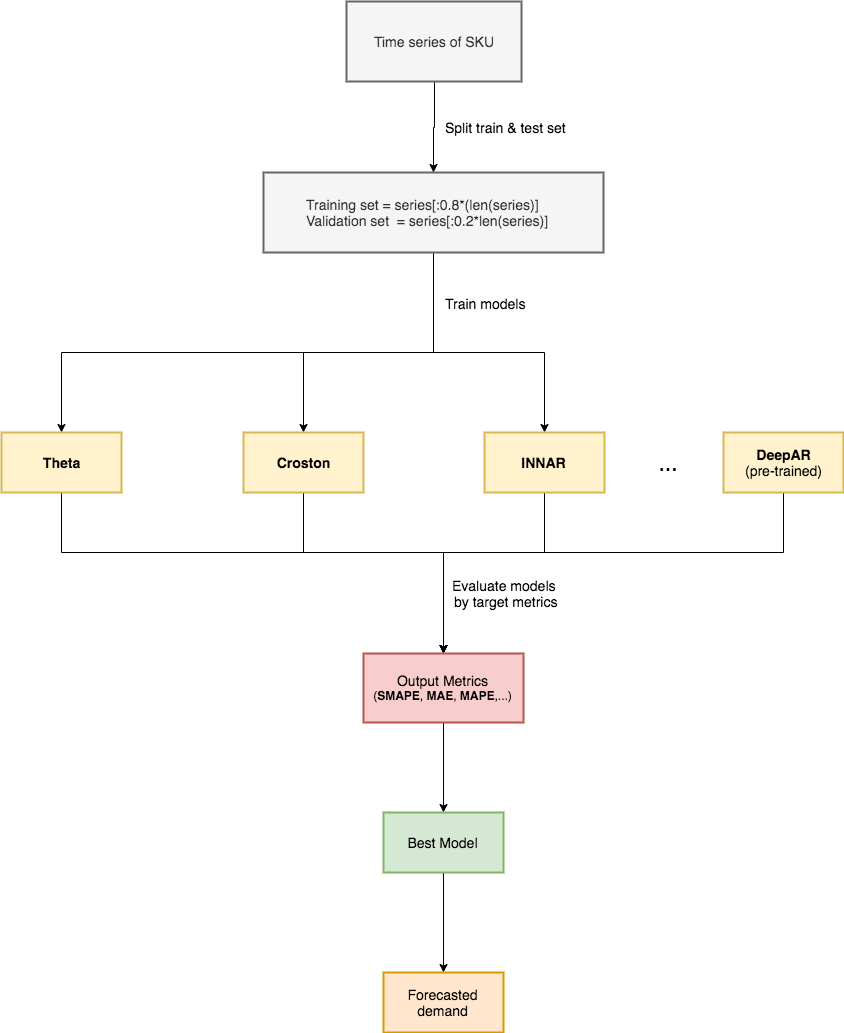
In the beginning, to limit the scope of the problem, we decided to consider the demand forecast as a natural forecasting time series problem. It means we only focused on the time series of demand and use it to forecast the demand in the future without considering other factors.
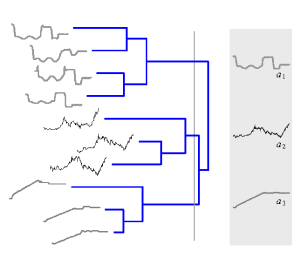
We collected time series of demand from historical data and clustered by its form. The output shows that we have to deal with a diversity of forms of time series. So we decided to use multiple classical time series forecasting methods. There are 6 classical methods we are currently using inside our engine, some of them are well-known methods, such as: Theta, INNAR, Croston,…
After first phase, we did analysis and realized that there are many factors affect the demand of products, especially things related to promotions. We faced with the difficulty to do feature engineering with classical methods. So we researched and applied DeepAR — A probabilistic forecasting with Autoregressive Recurrent Networks, that can integrate other signals to optimize the accuracy of forecasting results.
Because of having multiple models inside forecast engine, we applied a competition process to choose best model for each product. We use 20% time series of product to evaluate all models and choose the model has the best accuracy.

Evaluation
We use several forecasting metrics such as Mean Absolute Error (MAE), Mean Absolute Percentage Error (MAPE), but the key metric would be Symmetric Mean Absolute Percentage Error (SMAPE).
SMAPE is currently used as a official measurement method in well-known M4 forecasting competition.There are multiple versions of SMAPE, we use the following form:
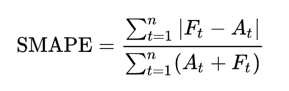
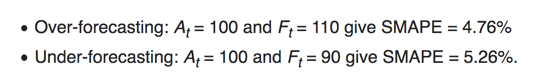
In comparing to MAPE, SMAPE has both lower and upper bound by providing result between 0% and 100%.
It also give different results for over and under forecasting, that is make sense when mapped to the impact created to business and customer.
Due to the need of business, we provide the forecast result every week. At each week-end, we collect the forecast and actual demand and use SMAPE to calculate the accuracy of forecast engine. The forecast engine provides forecasts that are up to 60% more accurate.
Feature engineering
Along with researching more forecasting methods, we consider feature engineering one of the most important process to uplift the accuracy of forecast engine.
We have a concept called Signals pool, which is a set of signals used for forecasting or experiments.
We start with the ideas or we would like to call it biases.
Let’s say I think that the traffic of Product detail page would impact to the demand.
Then our data analysis team would roll up their sleeves and get their hands dirty in our data warehouse, to bring insights and validate ideas.
The final list of new signals we have, we would do the ETL process and add new signals to signals pool. The experiment process then used to validate before we officially use new signals in production.
Experimental process
Let’s imagine we have a lot of ideas to improve the accuracy of forecasting results.
Changes from ideas could be:
- Add / remove methods from list of forecasting methods
- Add / remove signals from Signals pool
- Change the logic / target of competing method
- …
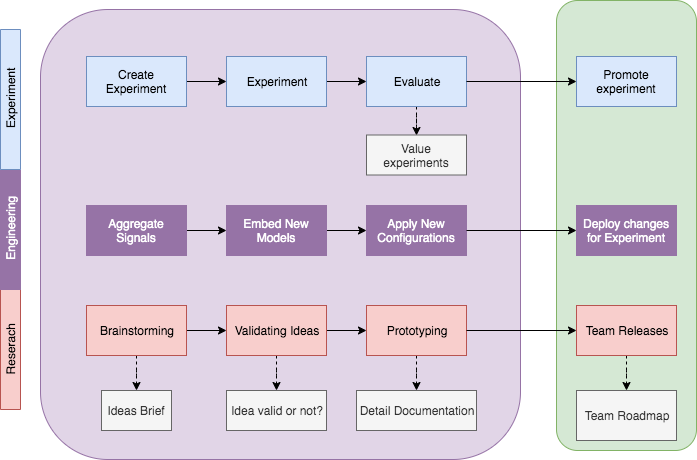
We built a process and foundation to support us the flexibility to experiment our changes quickly and easily.
An experiment is named by a Tag. We call what we have in production with the tag name is “OFFICIAL”.
The forecast engine could run forecasting result for multiple tags, include “OFFICIAL” tag and experimental tags. By benchmarking the results between tags based on key metrics, we could know which changes would improve our target metrics and decide to rollout change to production or not.
Future plan
Products segmentation
As we said before, we clustered product by its demand. The idea is to cluster product by other similarities like trend or sales volume.
By segmentation products to cluster, it will enable us the ability to analyze and troubleshoot easier. We could have dedicated that is specified for each cluster.
Forecast by regions
TIKI nowadays opens more and more warehouses to support the rapid growth of business. The demand forecast result right now is the overall demand of the product for the the entire network and currently broke down into regions by some rules bases.
The scaling of number of warehouses added complexity to this process and also decrease its accuracy. Our idea is to use order’s delivery address to extract demand by cluster and use it to forecast the demand by cluster systematically.
The difficulty of forecast by cluster is feature engineering process. Because the factors impact the demand is rarely able to break down by cluster, like promotion or coupons (right now there’s no region-targetted promotion/scheme).
Automate inventory replenishment process
After successfully calculate the forecast by regions, based on the past performance of forecast engine, we can define the threshold to select the range of products that the forecast engine has good performance and feed that directly to our replenishment system to automatically purchase it and reduce manual efforts.
Apply forecast result into human & resource planning
We currently provide the weekly forecast. By optimizing the speed of feature engineering, we plan to provide the forecast result by days and this will enable our warehouse to better plan for their human resource to optimize labour cost while still able to maintain good service.
Conclusion
Demand forecast is an interesting AI/ML/mathematics challenge that has very practical application in inventory replenishment and placement. Doing this well is a key advantage for an e-commerce business to satisfy customer, deliver a good service with optimal cost. It’s a journey and Tiki has made some potential progress, we’re looking to share more about this in the future.
Author: Khai Huynh